How To Normalize A Column In Pandas Dataframe
Let's learn the different ways we can normalize a column from a pandas dataframe in python.
Pandas: Pandas is an open source python library built on top of numpy. It is used in machine learning and data science for its various data structures and easy to use functions to manipulate data in dataframes. Pandas is well documented and has tools built on top of it like rapids to enhance speed and operate in a distributed environment.
Data Normalization: Data normalization is the process of transforming integer dataset features in a dataset into a standardized format for machine learning models to take as input. Standardizing data makes it easier for a machine learning model to learn the relationship between the inputs, without and one value dominating just because of the size of the number.
Steps toward standardized data:
- Import our libraries
- Add a pandas dataframe with data
- Use different normalization techniques on columns
Create A Pandas Dataframe:
Let's start by creating a dataframe:
Don't forget import pandas as pd!
And our output:
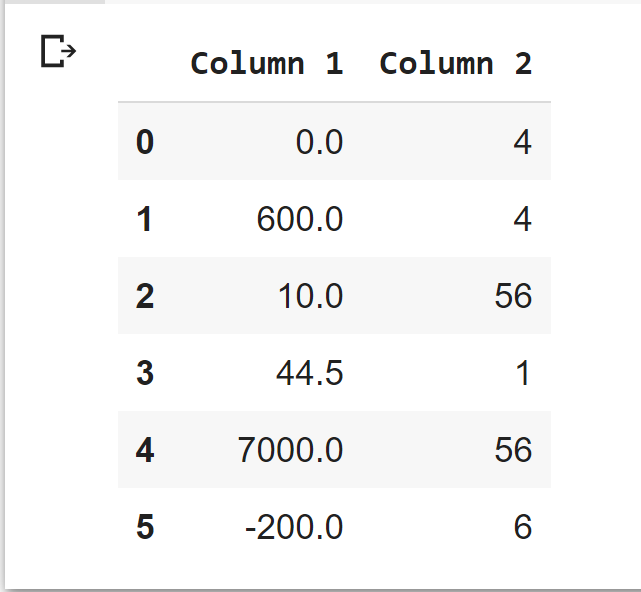
Neither column is normalized using any functions, and column one is clearly worse than column 2. We will apply normalization techniques to both of these columns.
Maximum Absolute Scaling for Column Normalization:
Maximum absolute scaling rescales each feature by the maximum absolute value. The estimator transforms the whole feature to have the maximum absolute value of 1. All sparsity in the dataset is kept as the function does not shift or center the data. Let's use this function from Sklearn, sklearn.preprocessing.MaxAbsScaler.
print new values:

This can also be done using pandas methods:

Using Min Max Scaler For Feature Normalization:
Minmax transforms features to a predefined range of values, usually normalizing to (min = 0, max = 1), which brings column values to a common numerical scale. To do this we can start by subtracting the minimum value of the entire column then divide by the column's range of values. Here's an example of the math, notice we calculate the range of the column with maximum value minus minimum value:

Lets take a look at using MinMaxScaler from Scikit Learn.
Tip: If you want to get the normalized values back when you fit you can use fit_transform(df)
Let's view our data output:
We can do print df:

Zero Score Dataframe Normalization:
Zero Score (or z-score) transforms the features of the column into values with a mean of 0 and a standard deviation of 1. This standardization is normally used as an alternative to minmaxscaler and is easy to implement with scipy. New normalized values are created by subtracting the mean of the entire feature then dividing by the deviation.
Dataframe output with mean = 0 & std = 1:

Sklearn Normalizer Method For A Feature:
Sklearns' normalizer function rescales individual values until its l2 or l1 norm is equal to one. This method well with both dense and sparse datasets, and is commonly used to normalize distribution for clustering and text classification. It's used the same as the above tools with fit and transform functions to normalize the column data.

Normalizer estimator from Sklearn
Power Transform To Produce Gaussian-Like Values In Pandas Columns:
Sklearns power_transform currently supports Box-Cox transform and the Yeo-Johnson transform. Box-Cox requires feature data to be positive while the latter supports both forms of integers. Both forms of transformation apply unit-variance normalization to the produced data.
Note: Nans in the the pandas columns are treated as missing values, not zeros. To learn more about Power Transform check out the sklearn api.
Normalize Pandas Dataframe With Quantile Normalization:
Quantile normalization can be used for an entire pandas dataframe, and requires that the statistical distribution of every feature is the same. The process consists of these steps:
- Put the values in each column in order from smallest two largest, while marking the original location of each value in the original dataframe.
- Find the mean of each row in the dataframe, and determine the "rank" of each row, from smallest mean to largest.
- Take the rank order mean and substitute it back in for the original values so that the original values are now the means from rows above.
- The new values have the same distribution. Check out this link to understand this process further.
What Should You Use For Machine Learning & Data Science?
Min max scaler is arguably the most popular method to normalize data before passing it into a model to train. By forcing values into a range of 0 to 1 you keep the model from focusing on larger integers and removes the negative sign, which can cause issues. Starting with min max and becoming confident in what it does and how it improves your models results is a great place to start. People that view your code will feel much more confident in your abilities as an ML dev seeing min max or normalizer.
We've used mms on most of our projects, and really shows its benefits when building systems that have lots of features that might not be from the same datasource, like recommendation systems.
